Intraday trading has long been a popular style among many market players who would like to capture profits during a single trading day. Intraday differs, with sharply observant judgment and quick decisions, structured plans. While many people prefer such indicators of the average moving indicator or RSI, they have missed one of the purest methodologies focusing on natural behavior within the market-price movement. This style of trading relies exclusively on raw price movement when establishing a trade, avoiding dependency on outside technical instruments.
Understanding Price Action in Intraday Trading
Price action refers to the movement of price over time, typically on candlestick or bar charts. Each candle represents the tussle between buyers and sellers, and the resulting patterns formed by such candles can provide vital clues about the market-situation formation in relation to support and resistance.
In intraday trading, price action has the following significant advantages:
Signal Clarity – There is usually no lag between data interpretation and use, since there is no indicator.
Flexibility – Price action works on various time periods and industries.
The trader by focusing directly on price can build a deeper understanding of how psychology impacts the market.
Preparing the Chart
To be able to trade intraday via pure price action, one must prepare the chart carefully:
Time Frame Selection: Normally, most traders use either 5-minute, 15-minute, or 30-minute intraday charts. The choice mostly relies on how active a trader is, as well as the speed of transaction execution.
Candlestick Charts: These provide very detailed information with open, high, low, and close prices. Candlestick formation often provides signals of momentum, reversal, or continuation.
Key Levels: Mark the support and resistance zones from the previous day’s highs/lows and important intraday turning points.
This is how to build toward a zero-indicators technique.
Identifying Market Structure
Price action analysis starts off with the identification of trend or structure:
Higher Highs and Higher Lows – Indicating uptrend
Lower Highs and Lower Lows – Indicating da owntrend
Sideways Movement – suggesting consolidation
Recognizing Candlestick Signals
Even without indicators, candlestick formations themselves act as signals. Some common examples include:
Pin Bars: These are potential reversal zones, when wicks reject certain price levels.
Engulfing Patterns: These suggest strong directional momentum when one candle engulfs the previous one.
Inside Bars: These usually are an indication of breakout movement to follow a phase of consolidation.
When these signals are seen at areas of key support or resistance, they can identify intraday trade entries with much better precision.
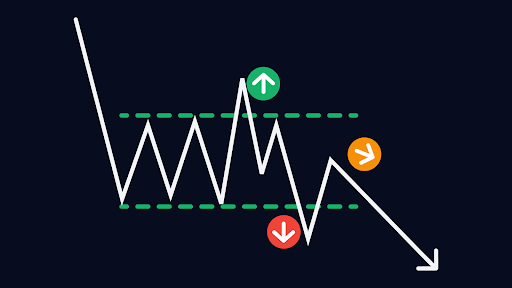
Using Support and Resistance Zones
Support Zones: These are areas where price generally stops falling.
Resistance Zones: Areas where rising prices meet their barriers.
Breakouts and Retests – Breakouts above resistance level or below support level, and retest normally makes great entry points.
Since these zones can also be used with candlestick signals, traders now have very reliable setups without indicators.
Entry and Exit Planning
Trading without indicators requires discipline in entries and exits:
Entry: Search for confirmation of candlesticks below support or above resistance in the direction of the market structure as a whole.
Stop-Loss: Stop-losses will be placed at just below support (for long trades) or above resistance (for short trades) to minimize risk.
Targets: Set point target based on either use of recent swing points or risk-reward ratio such as 1:2 or 1:3.
This approach avoids emotional decision making as regards the indecision prevalent in intraday trading.
Importance of Risk Management
Indeed, even without practical risk management, a zero-indicators strategy will automatically fail. This includes:
Position Sizing: Never risk half of your capital on a single trade.
Limits to Daily Losses: Set a number of maximum days losses to be kept within the discipline.
Consistency: Be firm on the setups planned to avoid overtrading.
Price action brings strict risk control together to form a balanced approach.
Benefits of Zero Indicators
Trading intraday in pure price action has a few advantages:
Conciseness – The chart is relatively clean and does not have clutter from seriatim of indicators.
Speed in Analysis – Decision is made quickly as price provides real-time information.
Pointed Market Psychology – Traders much better understand sentiment by taking into account how price reacts against these important levels.
This in essence means that a trader can keep adapting as the day goes on.
Conclusion
A trading strategy must also be precise, patient, and at the same time disciplined. While there are a number of strategies whose foundation is strictly on indicators, a zero-indicators method based on price action offers a very easy but effective alternative. One can create a structured approach by observing candlestick patterns, identifying market structure, and respecting support and resistance. For traders beginning their journey, pairing such a strategy with a Free Demat account can make the process even more accessible.